Train computer vision models
Working on Computer Vision models
Comet has extensive support for tracking, analyzing and debugging computer vision models. In addition with integrations with the model popular frameworks (Pytorch, Yolov5 / Yolov8, Keras), Comet has deep visualization capabilities when it comes to viewing images.
Logging and Visualizing Images and Annotations
When developing models for computer vision, it is often useful to log and visualize the images and associated annotations. Comet provides support for logging two types of annotations: bounding boxes and regions. In this guide, we will discuss how to log and visualize image models and image annotations using Comet.
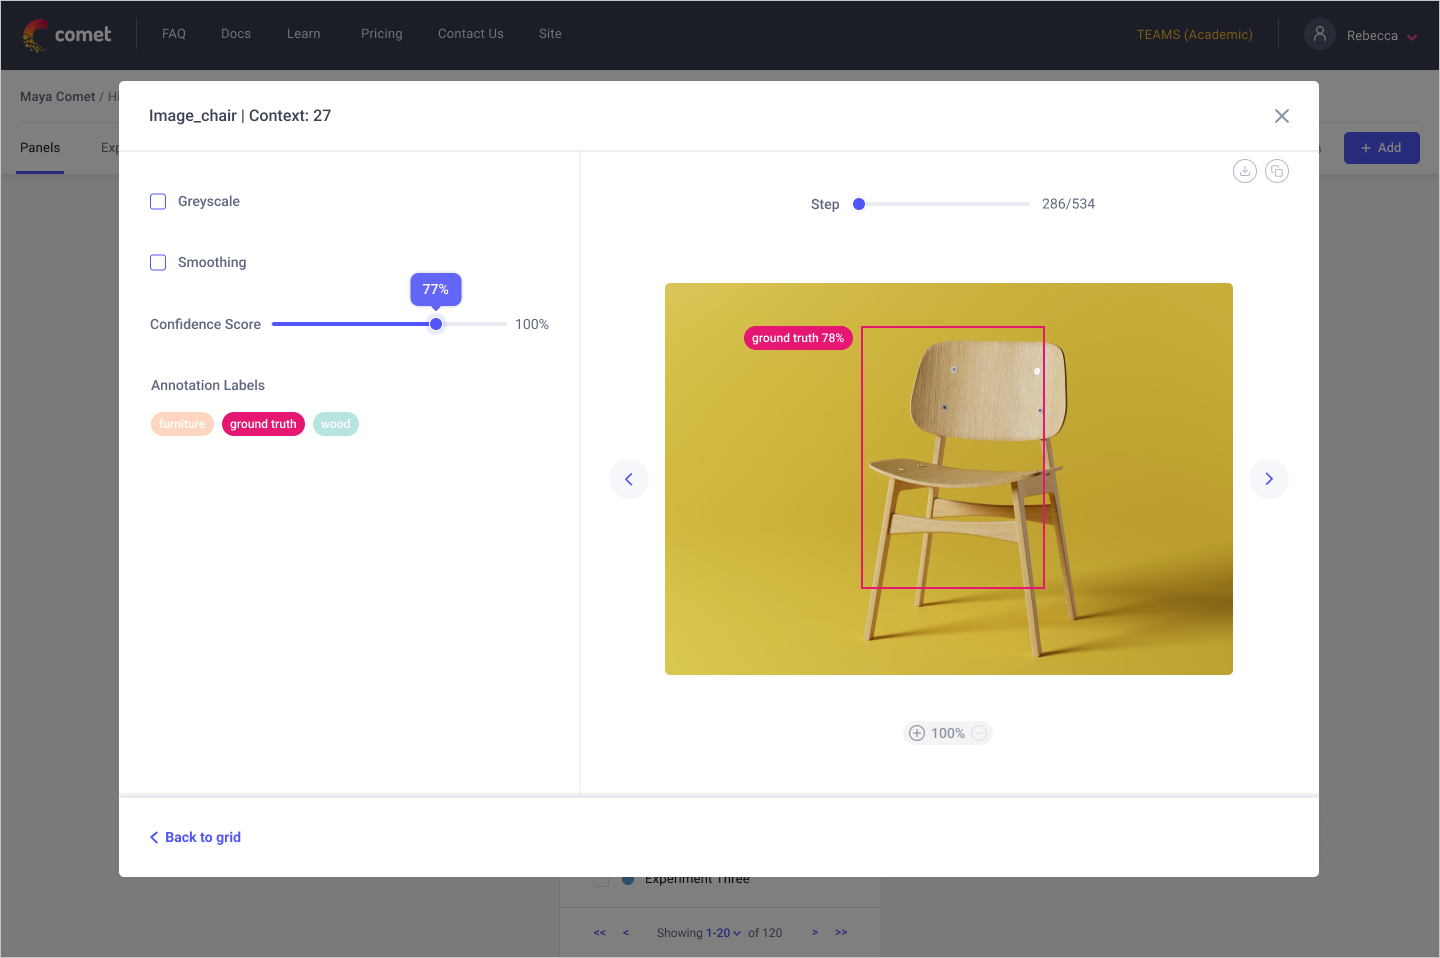
Logging Bounding Boxes
Bounding boxes are used to annotate specific regions of an image. To log bounding boxes in Comet, use the following code:
annotations = [
    {
     "name": "Predictions",
     "data": [
        {
         "boxes": [[x, y, w, h]],
         "label": "dog",
         "score": None,
        },
        {
         "boxes": [[x, y, w, h]],
         "label": "Cat",
         "score": 0.934,
         "id": "12345"
        },
     ],
    }
]
experiment.log_image("image.png", annotations=annotations)
Here, annotations is a list of dictionaries, where each dictionary represents an annotation layer. The data field of each dictionary is a list of annotations, where each annotation is represented as a dictionary with fields for the bounding box coordinates, label, score, and metadata. Once logged, the bounding boxes will appear on the image with the associated label and score (if provided). The color of the bounding box is determined by the label.
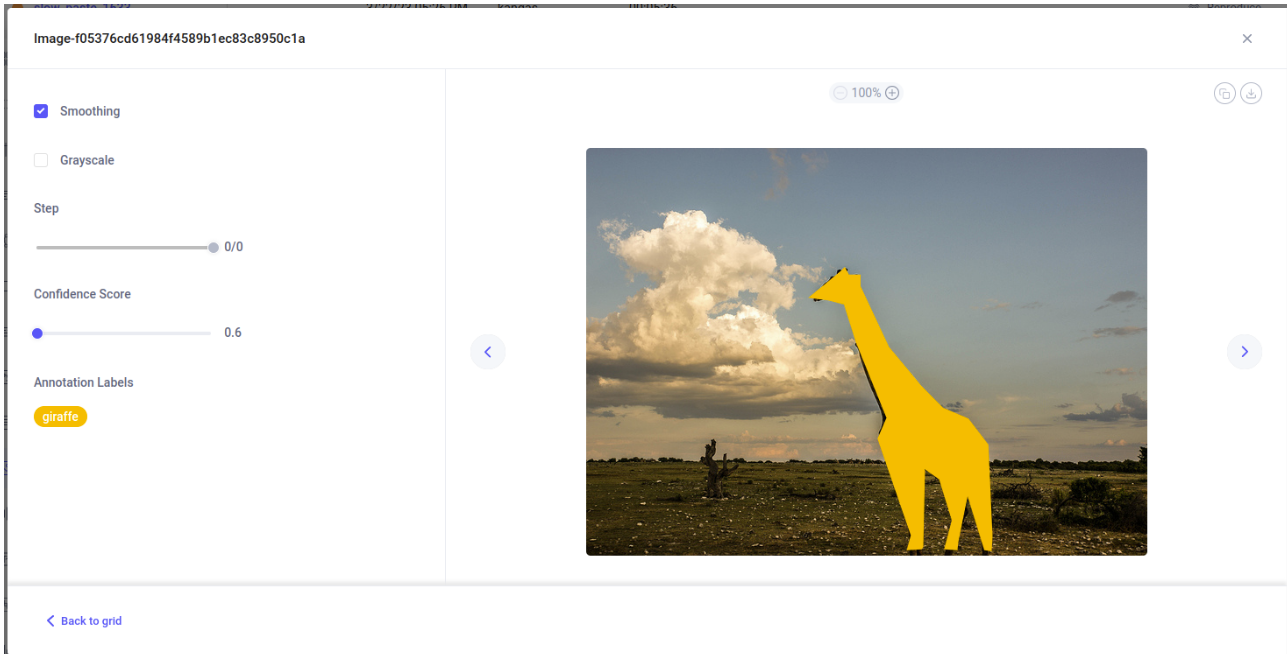
Logging Regions
Regions are used to annotate a polygonal region of an image. To log regions in Comet, use the following code:
annotations = [
    {
     "name": "(uncategorized)",
     "data": [
        {
         "points": [[x1, y1, x2, y2, x3, y3, x4, y4]],
         "label": "giraffe",
         "score": None,
        }
     ],
    }
]
experiment.log_image("image.png", annotations=annotations)
The full annotations structure can be found under Experiment.log_image().
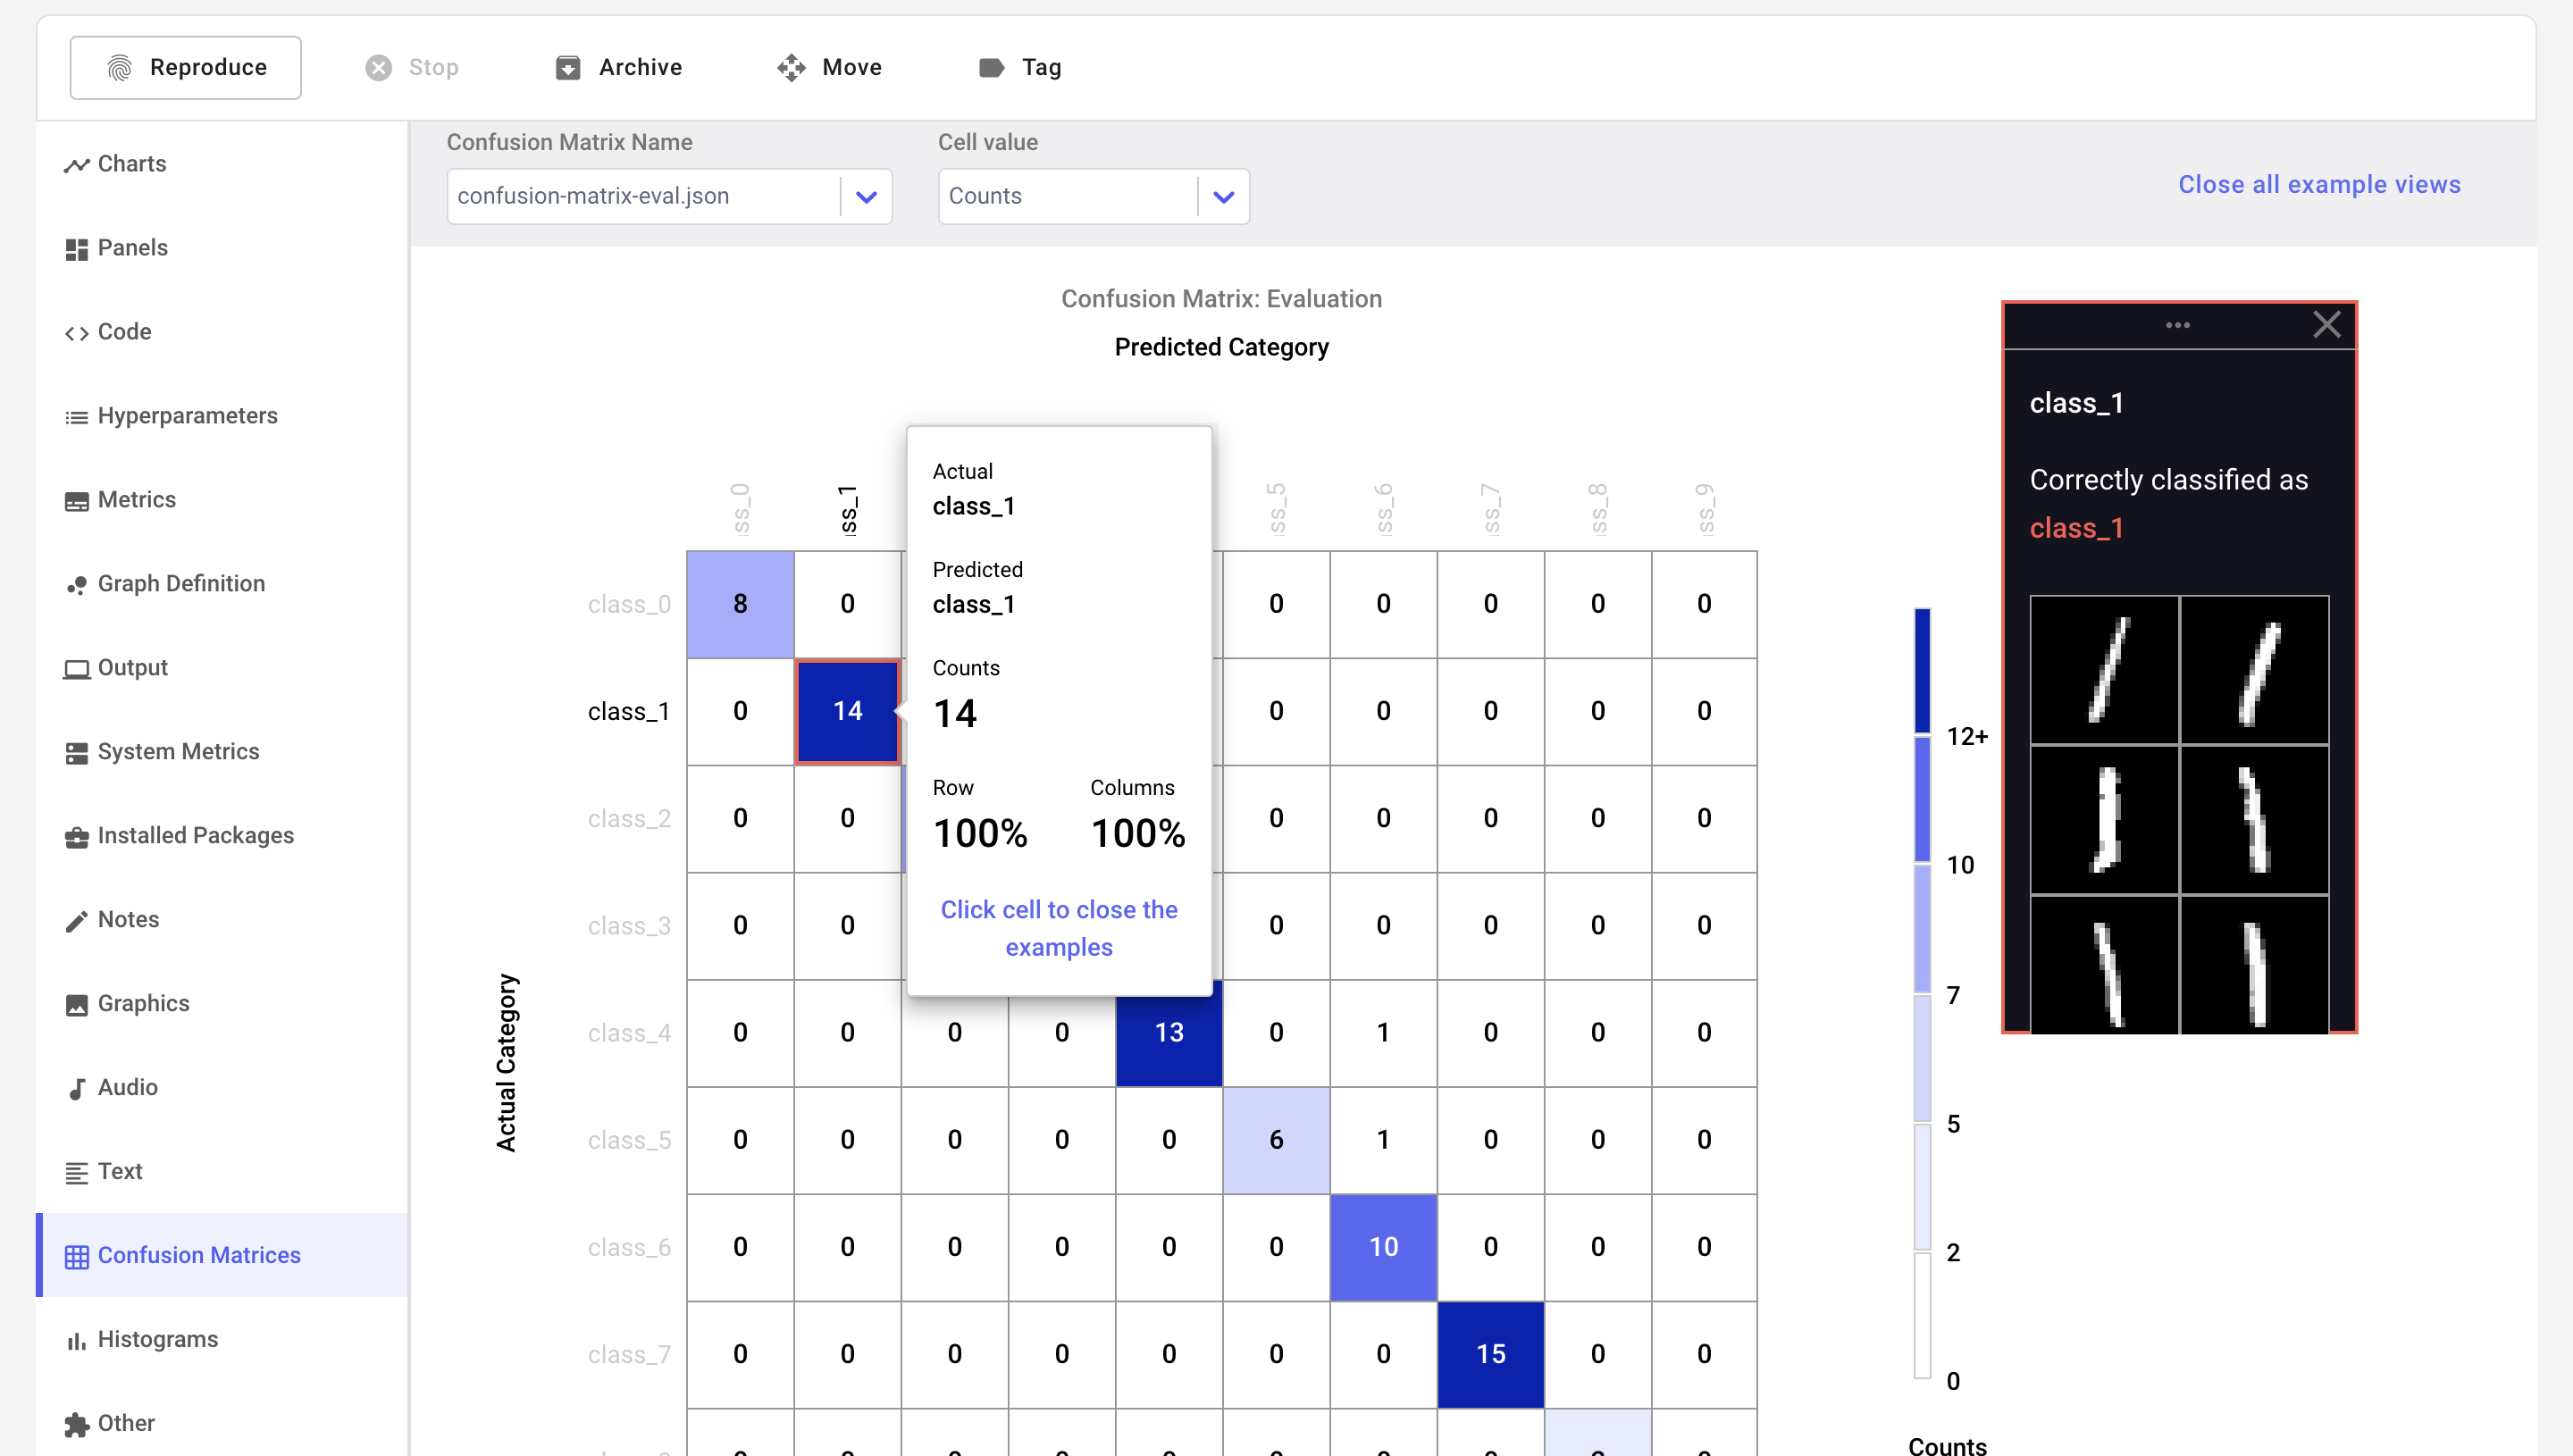
Logging Images to Confusion Matrices
Confusion matrices are a key part to analyzing the output of models used for classication use-cases. You can log confusion matrices in Comet with just a couple of lines of code:
# Logs the image corresponding to the model prediction
experiment.log_confusion_matrix(
    y_test,
    predictions,
    images=x_test,
    title="Confusion Matrix: Evaluation",
    file_name="confusion-matrix-eval.json",
)
In the experiment view, you can now view the confusion matrices as well as a sample of images for each cell.
Learn more
You can learn more about working with image models in our full example in which we classify hand-written numbers: Image Tutorial