Track a training run
Once data has been logged in Comet using either automatic logging capabilities or using one of Comet's SDKs, you can track training runs using the single experiment view.
Single experiment view
You can reach the single experiment view in either of these two ways:
- Following the URL logged by Comet when an Experiment is started.
- Going to the project dashboard and clicking the experiment name.
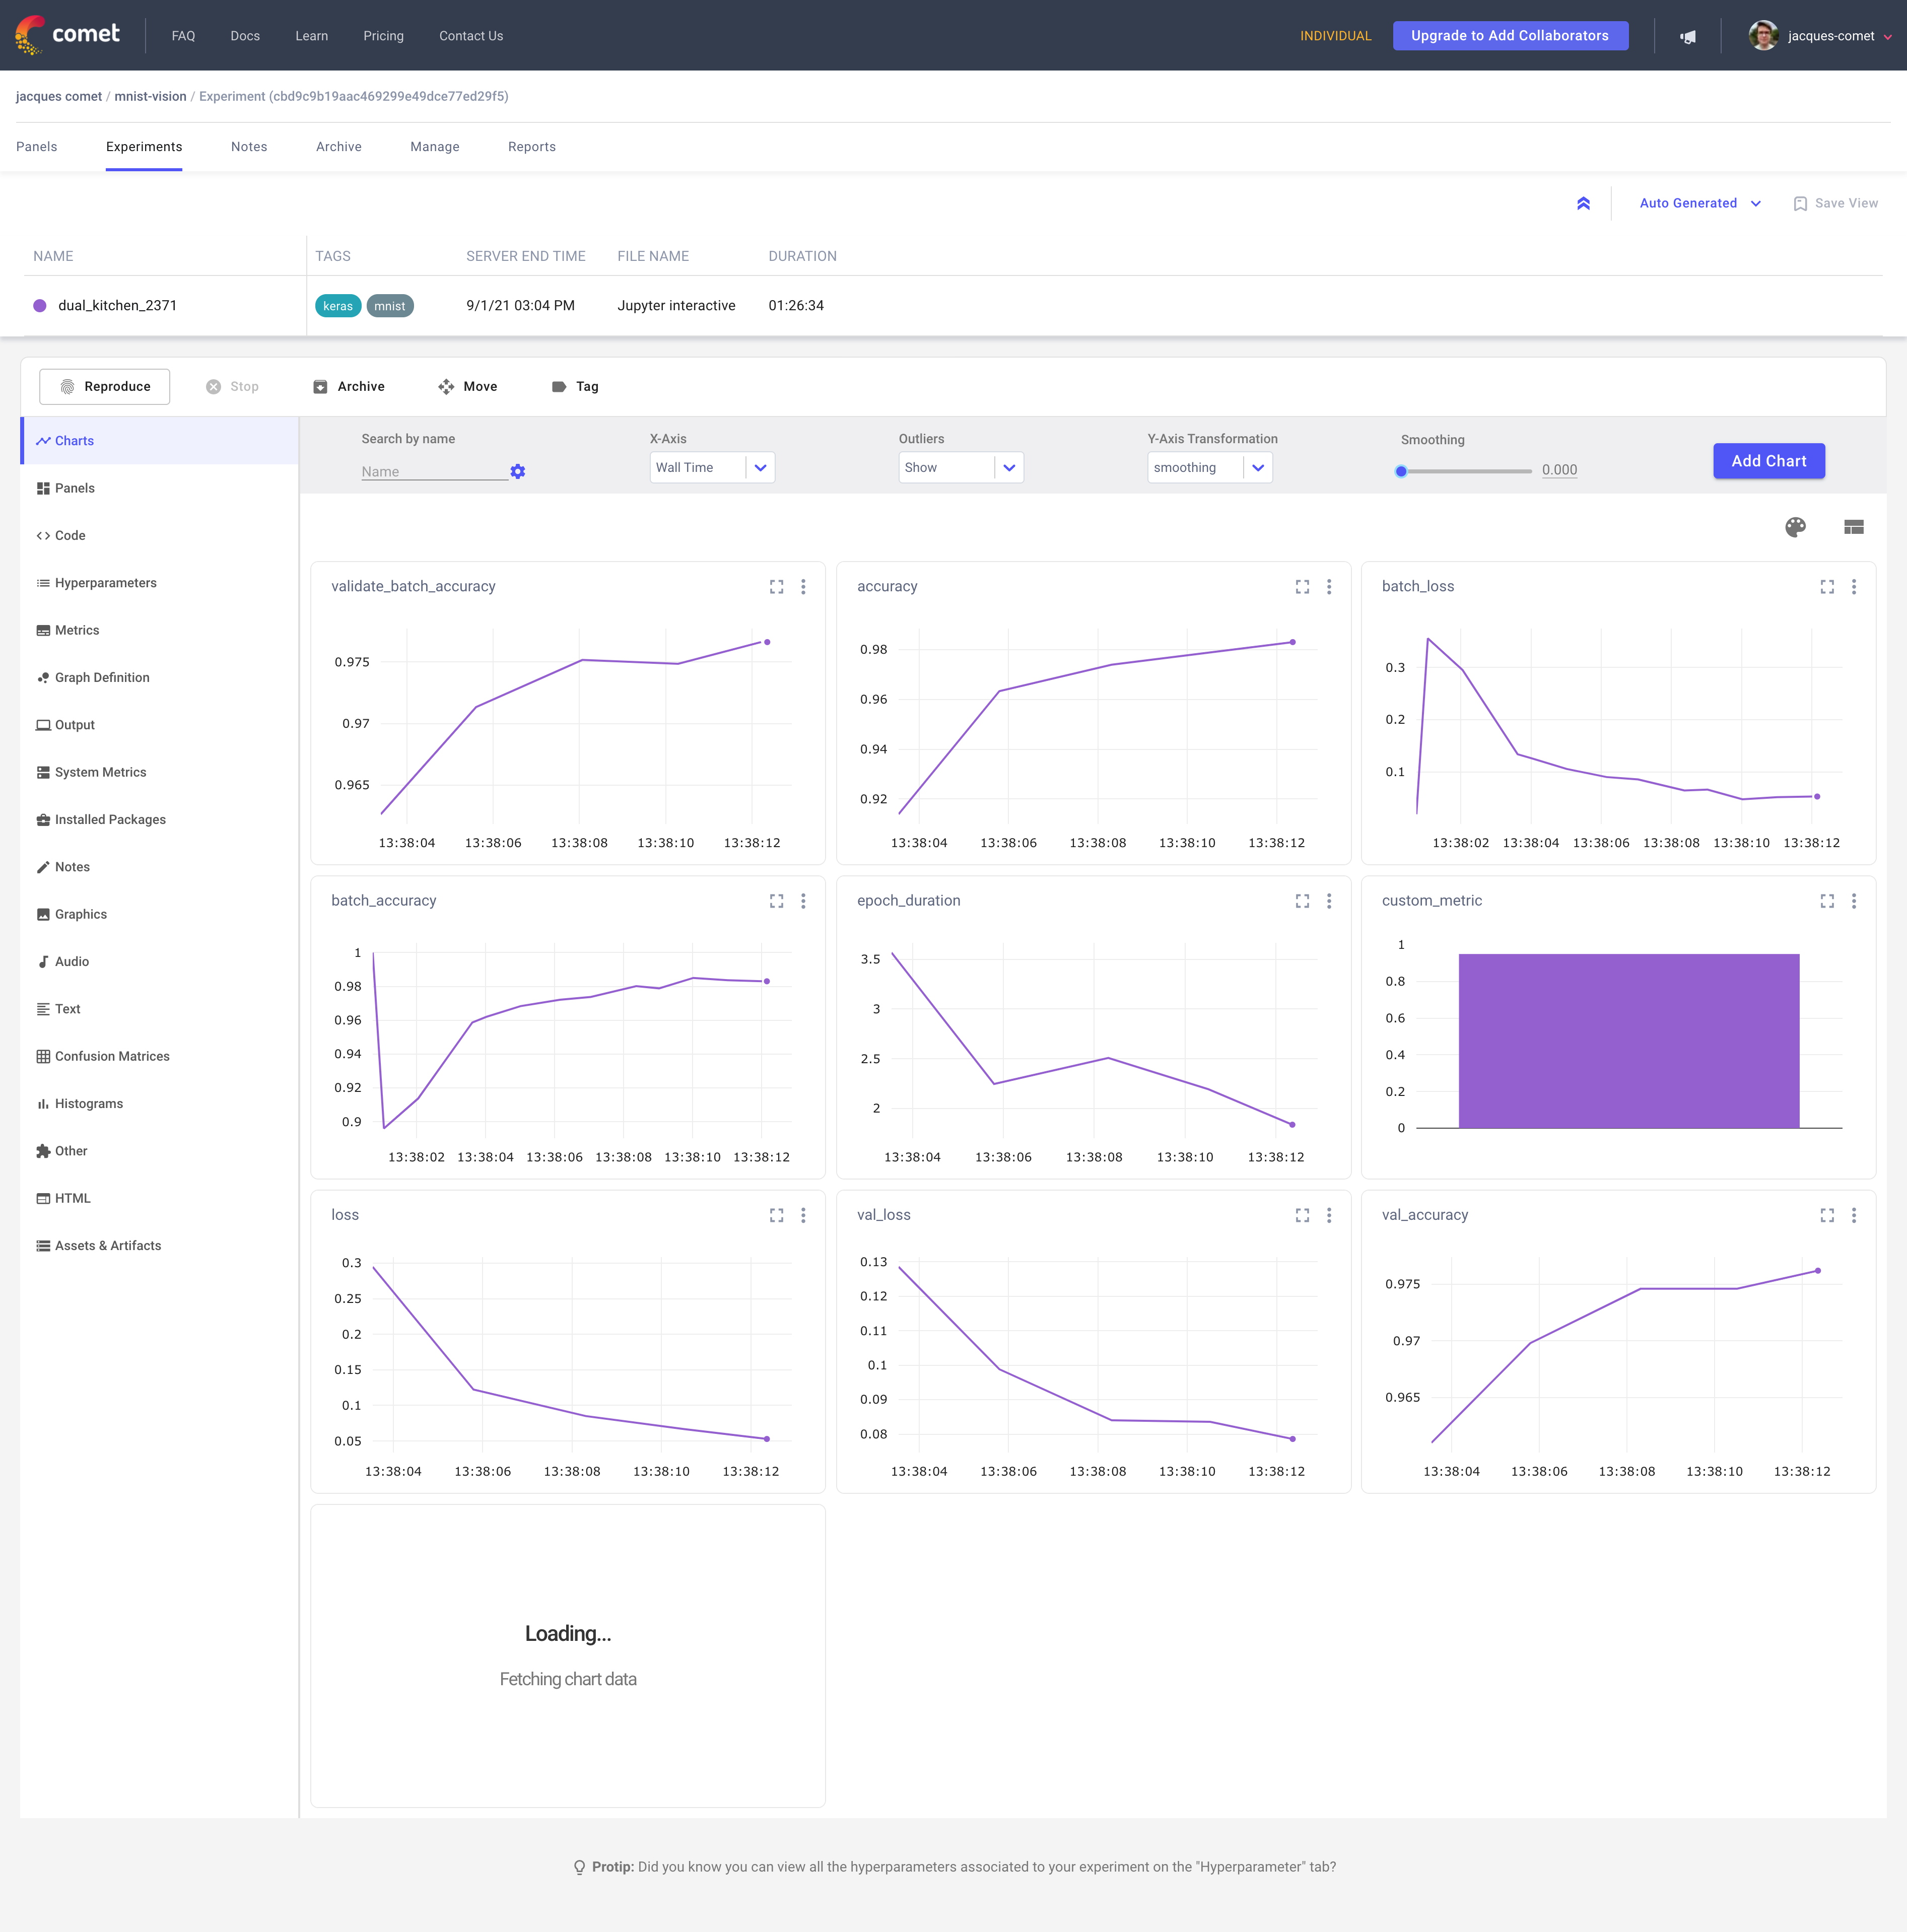
Information available in the single experiment view
The single experiment view gives you access to all the data that was logged for a given experiment. This includes:
- Charts and Panels: Visualizations of the metrics tracked during a training run.
- Code: Contains the source of the program used to run the Experiment.
- Parameters: Hyperparameters logged during the training run.
- Metrics: Summary table of the metrics logged during the training run.
Advanced features
In addition to logging metrics, hyperparameters and code to Comet, you can also log additional data based on your use case. For example, if you are working on an NLP model, you could log text data; if you are working on an image model, you could log images.
To find a list of all data that can be logged to Comet, see Experiment.
Reproduce a training run
The Reproduce button lets you rerun your experiment with the same code, command, and parameters, by capturing the state of the Git repository that contains your training script and that includes both committed and uncommitted file changes.
For more information, see Reproduce an Experiment run.
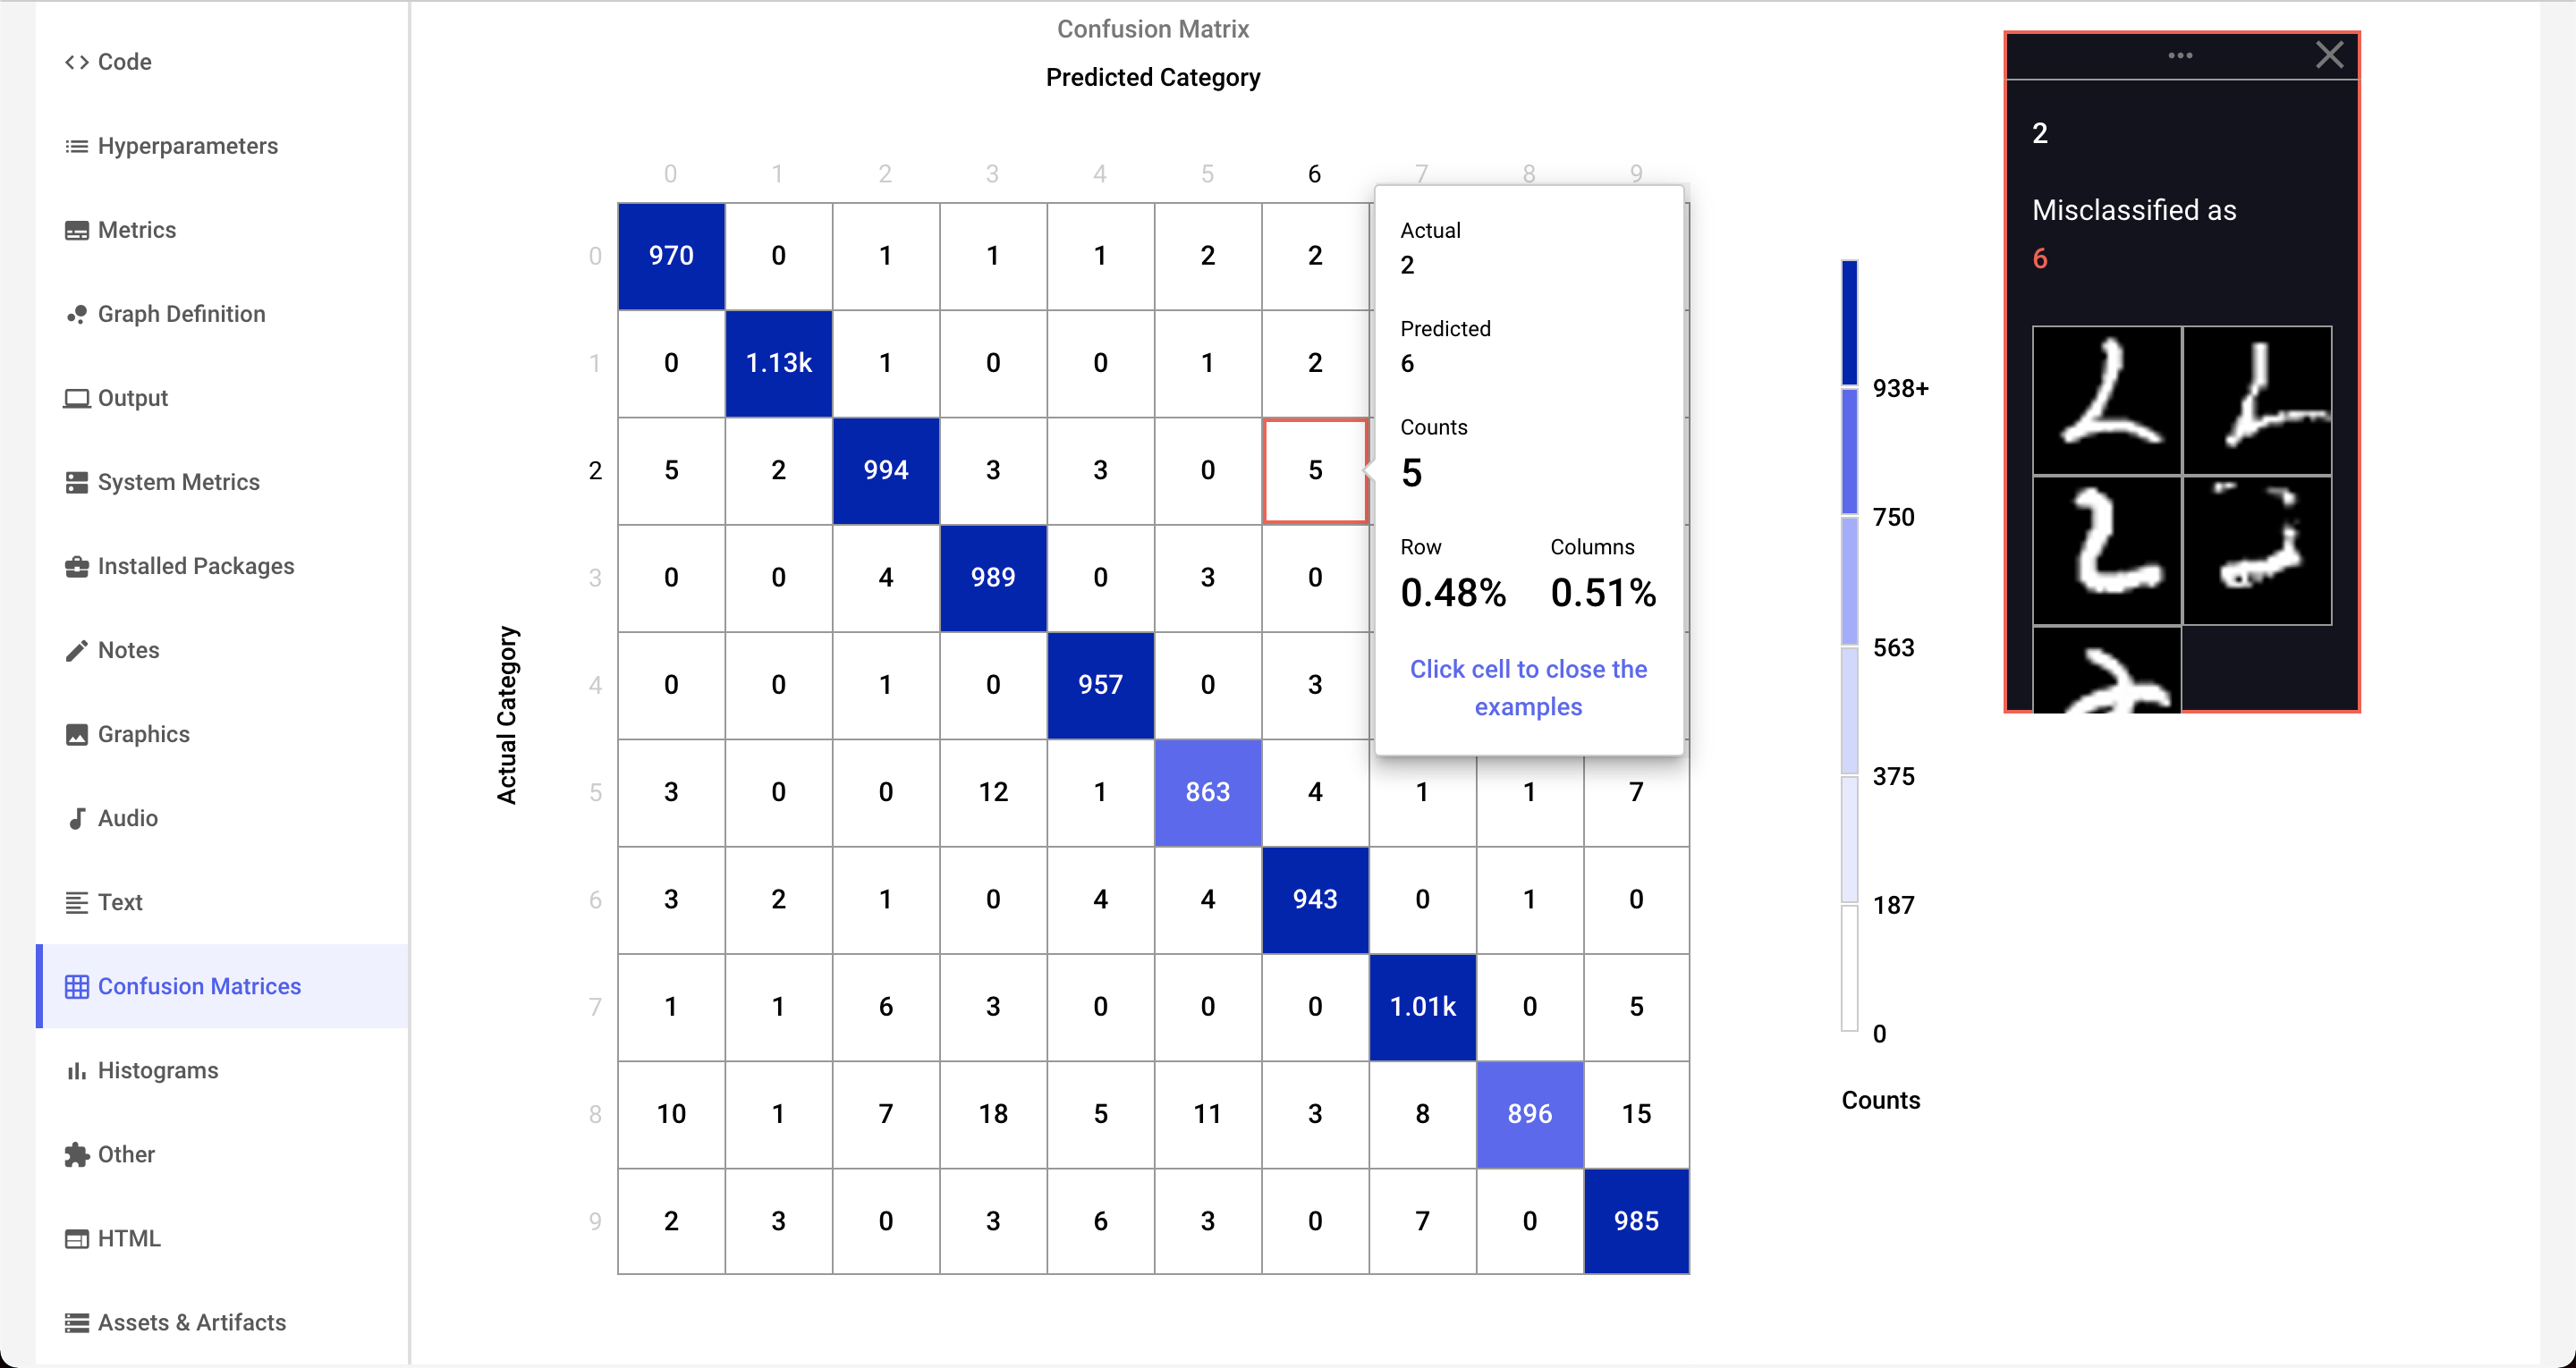
Log confusion matrices
Confusion matrices are very useful for showing the results of categorization problems, like the MNIST digit classification task. In addition to displaying information about the predicted and actual labels, the Comet confusion matrix can also be used to visualize individual training samples associated with each cell.
Try it out!
To learn more about how to log confusion matrices to Comet, check out this interactive confusion matrix tutorial.
![]()